Research
The scorelines football fans over- and under-predict
By Denver (@Denveloper), founder of CalledItMate · Published October 2026
We compared 22,221 score predictions made by 971 players on CalledItMate, a free football prediction game, with the final scores of the 5,617 completed matches they were made on, all kicking off between 22 March and 30 September 2026.
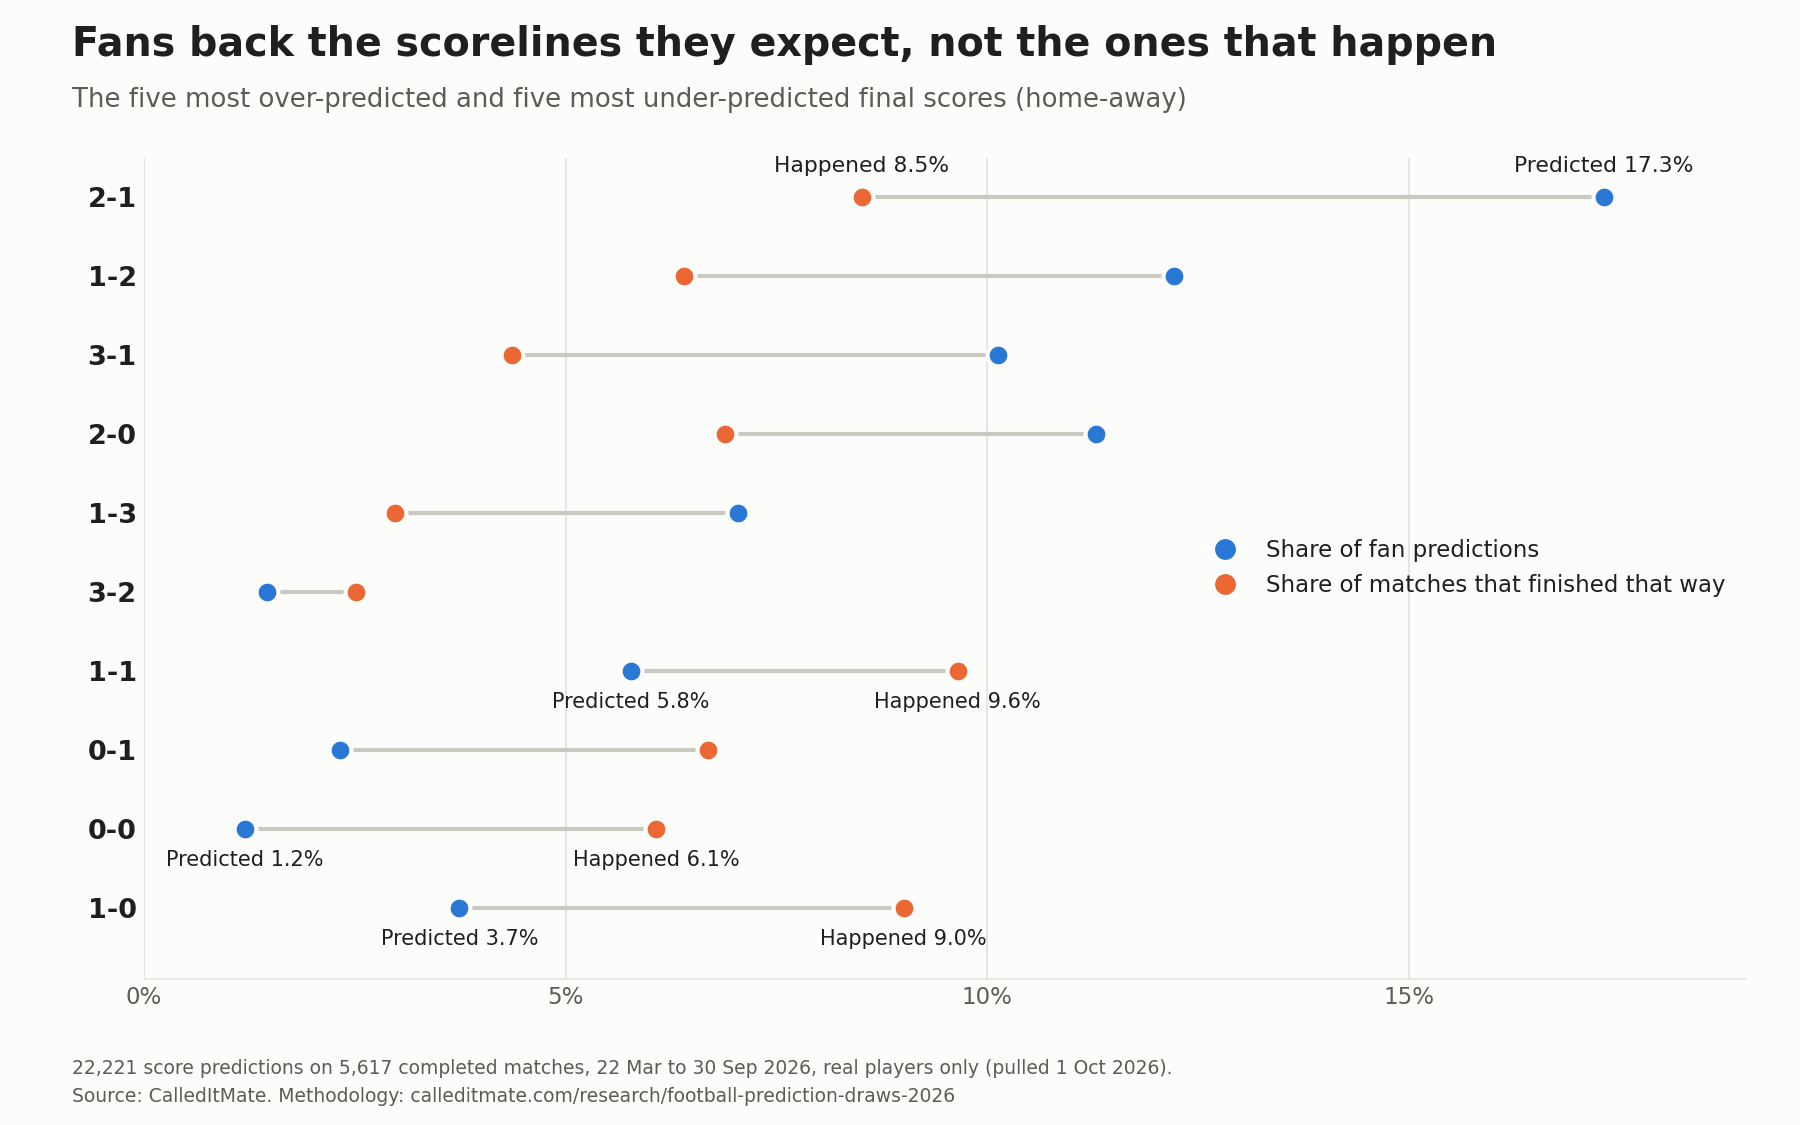
0-0 ended 6.1% of matches but got 1.2% of predictions, about a fifth of its share. 2-1 got 17.3% of predictions, more than any other score, and ended 8.5% of matches.
Aggregate data: download the CSV. The chart and data are free to use with attribution to CalledItMate.
Fans back decisive scores and skip the tight ones
2-1, 1-2, 3-1 took 39.7% of all predictions between them, but ended only 19.3% of matches. The three tightest results went the other way: 1-0, 0-1, 0-0 ended 21.8% of matches between them and got 7.3% of predictions.
1-1 was the most common final score of all (542 matches, 9.6%), and got 5.8% of predictions. The pattern describes what fans predict, not why: the data cannot say whether it is optimism, habit or something else. For draws in detail, see Football fans predict draws half as often as they happen.
Every common scoreline
Sorted from most over-predicted to most under-predicted. The gap is the share of predictions minus the share of matches, in percentage points. Scorelines are home-away, so 1-2 is an away win by one goal.
| Score | Predictions | Matches | Gap |
|---|
| 2-1 | 3,847 (17.3%) | 478 (8.5%) | +8.8 |
| 1-2 | 2,715 (12.2%) | 360 (6.4%) | +5.8 |
| 3-1 | 2,251 (10.1%) | 245 (4.4%) | +5.8 |
| 2-0 | 2,510 (11.3%) | 387 (6.9%) | +4.4 |
| 1-3 | 1,566 (7.0%) | 167 (3.0%) | +4.1 |
| 3-0 | 1,517 (6.8%) | 272 (4.8%) | +2.0 |
| 0-2 | 1,317 (5.9%) | 244 (4.3%) | +1.6 |
| 0-3 | 700 (3.2%) | 139 (2.5%) | +0.7 |
| 0-4 | 201 (0.9%) | 54 (1.0%) | -0.1 |
| 6-0 | 19 (0.1%) | 23 (0.4%) | -0.3 |
| 0-5 | 63 (0.3%) | 37 (0.7%) | -0.4 |
| 1-5 | 22 (0.1%) | 27 (0.5%) | -0.4 |
| 3-4 | 4 (0.0%) | 23 (0.4%) | -0.4 |
| 4-3 | 2 (0.0%) | 26 (0.5%) | -0.5 |
| 1-4 | 203 (0.9%) | 78 (1.4%) | -0.5 |
| 5-2 | 9 (0.0%) | 31 (0.6%) | -0.5 |
| 5-0 | 77 (0.3%) | 51 (0.9%) | -0.6 |
| 4-0 | 405 (1.8%) | 135 (2.4%) | -0.6 |
| 2-4 | 46 (0.2%) | 47 (0.8%) | -0.6 |
| 4-2 | 71 (0.3%) | 56 (1.0%) | -0.7 |
| 4-1 | 284 (1.3%) | 110 (2.0%) | -0.7 |
| 5-1 | 34 (0.2%) | 53 (0.9%) | -0.8 |
| 3-3 | 15 (0.1%) | 55 (1.0%) | -0.9 |
| 2-2 | 824 (3.7%) | 260 (4.6%) | -0.9 |
| 2-3 | 247 (1.1%) | 119 (2.1%) | -1.0 |
| 3-2 | 324 (1.5%) | 141 (2.5%) | -1.1 |
| 1-1 | 1,283 (5.8%) | 542 (9.6%) | -3.9 |
| 0-1 | 516 (2.3%) | 376 (6.7%) | -4.4 |
| 0-0 | 266 (1.2%) | 341 (6.1%) | -4.9 |
| 1-0 | 831 (3.7%) | 506 (9.0%) | -5.3 |
Scorelines with fewer than 20 matches and fewer than 100 predictions are left out of the table and the CSV.
Methodology
- Window: matches that kicked off from 22 March 2026 to 30 September 2026 inclusive (UTC), finished, and have a recorded final score. Data read on 1 October 2026 and frozen.
- Score prediction: a player's predicted final score for a match, at most one per player per match, as held at kick-off.
- Shares: a scoreline's share of predictions counts each prediction once; its share of matches counts each match once, among matches that received at least one prediction.
- Excluded: house accounts run by CalledItMate, internal test matches, and duplicate accounts merged into another account.
- Same window as the draws study, read later the same day: a few more results had settled and accounts had been merged, so totals here (22,221 predictions, 5,617 matches) are slightly higher than that study's. Quote each study with its own totals.
- Limitations: CalledItMate players are a self-selected group of football fans, not a random sample of the public, and the competition mix follows what they chose to predict.